I will come up with the description soon. Meanwhile, have a look at the video.
30 March, 2013
AUTOMATED SOLDERING ROBOT
I will come up with the description soon. Meanwhile, have a look at the video.
21 February, 2013
PLOTTING 3D GRAPHS USING MATLAB
In continuation to my post PLOTTING 2-D GRAPHS USING MATLAB which explained plotting various 2-D graphs and defining graph, figure, colour and background properties etcetera, my current post explains plotting 3-D graphs and related functions.
To start with, the function used here is plot3( ) for plotting 3-D graphs. We will plot a sphere and before it let us see the code to plot a circle centred at (2,2) of radius 2.
x=0:0.01:4;
y=((4-(x-2).^2).^0.5)+2; % semicircle for y>0
plot(x,y)
hold on
y=-((4-(x-2).^2).^0.5)+2; % semicircle for y<0
plot(x,y)

Keeping the above example in mind let us plot a sphere centred at (2,2,0) of radius 2.
for i=-20:20 % for plotting 40 circles.. u can increase or
% decrease
z=i/10; % z can obtain the values from -2 to +2 in a
% sphere with centre (2,2,0) and radius 2
r=(4-z*z)^0.5; % r is radius of circle in xy plane, equation
%of a sphere is x^2+y^2+z^2=2^2 and x^2+y^2=r^2
x=2-r:0.01:2+r;% as 2,2 is the centre of xy plane
a=x./x; % a converted to a vector of same size as x
z=z*a;
y=((r^2-(x-2).^2).^0.5)+2; % circle eqn
plot3(x,y,z)
hold on
y=-((r^2-(x-2).^2).^0.5)+2;% circle eqn
plot3(x,y,z)
end

In order to study the 3-D plot from every angle, MATLAB provides "Rotate 3D" feature which is demonstrated by rotating the above plotted sphere to an angle.

There are some more codes by which a sphere can be drawn. Let us plot a sphere of radius 2 by using polar coordinates.
r=2; % radius 2
o=0:0.1:2*pi; % theta
for i=0:31.4
h=i/10; % phi
x=r*sin(o)*cos(h);
y=r*sin(o)*sin(h);
z=r*cos(o);
plot3(x,y,z);
hold on
end

Now see the following code to generate the sphere via meshgrid( )
a=-1:0.05:1; % an array
b=-1:0.05:1; % another array
[x,y]=meshgrid(a,b); % generates all the possible coordinate
%range from (-1,-1) to (1,1)
z=(1-(x.^2+y.^2)).^0.5; % equation of sphere with radius 1 and
%origin as centre
for i=1:41
for j=1:41
if imag(z(i,j))==0 % check to plot only real values that
%satisfy the eqn of sphere as they are
%the true values
plot3(x(i,j),y(i,j),z(i,j)) % plotting individual points
hold on
end
end
end
hold on
z=-((1-(x.^2+y.^2)).^0.5);
for i=1:41
for j=1:41
if imag(z(i,j))==0
plot3(x(i,j),y(i,j),z(i,j))
hold on
end
end
end

Using the meshgrid function and polar coordinates we have the following code for a sphere.
r=2; % radius =2
phi=linspace(0,pi,50); % phi=0 to pi divided in 50 slots
theta=linspace(0,2*pi,50);
[phi,theta]=meshgrid(phi,theta);
x=r*sin(phi).*cos(theta);
y=r*sin(phi).*sin(theta);
z=r*cos(phi);
plot3(x,y,z)

Now let us plot some other figures.Following is the code to plot a cone
o=pi/4; % apex angle/2
l=5;
for h=0:0.01:l*cos(o); % height from min to max
r=(l*cos(o)-h)*tan(o); % radius of the circle to pe plot in x,y plane
x=-r:0.01:r; % range of x
z=(x./x)*h; % z converted to a vector of same size as x
y=(r^2-x.^2).^0.5;
plot3(x,y,z);
hold on
w=-(r^2-x.^2).^0.5;
plot3(x,w,z);
hold on
end

Now let us plot a cube with 4 sides of side length 2 :-
x=0:0.01:2;
y=(x./x)*0;
w=(x./x)*2;
for a=0:0.01:2
z=(x./x)*a;
plot3(x,y,z) % xz plane plotted at y=0
hold on
plot3(x,w,z) % xz plane plotted at y=2
hold on
plot3(w,x,z) % yz plane plotted at x=2
hold on
plot3(y,x,z) % yz plane plotted at x=0
hold on
end


To start with, the function used here is plot3( ) for plotting 3-D graphs. We will plot a sphere and before it let us see the code to plot a circle centred at (2,2) of radius 2.
x=0:0.01:4;
y=((4-(x-2).^2).^0.5)+2; % semicircle for y>0
plot(x,y)
hold on
y=-((4-(x-2).^2).^0.5)+2; % semicircle for y<0
plot(x,y)
Keeping the above example in mind let us plot a sphere centred at (2,2,0) of radius 2.
for i=-20:20 % for plotting 40 circles.. u can increase or
% decrease
z=i/10; % z can obtain the values from -2 to +2 in a
% sphere with centre (2,2,0) and radius 2
r=(4-z*z)^0.5; % r is radius of circle in xy plane, equation
%of a sphere is x^2+y^2+z^2=2^2 and x^2+y^2=r^2
x=2-r:0.01:2+r;% as 2,2 is the centre of xy plane
a=x./x; % a converted to a vector of same size as x
z=z*a;
y=((r^2-(x-2).^2).^0.5)+2; % circle eqn
plot3(x,y,z)
hold on
y=-((r^2-(x-2).^2).^0.5)+2;% circle eqn
plot3(x,y,z)
end
In order to study the 3-D plot from every angle, MATLAB provides "Rotate 3D" feature which is demonstrated by rotating the above plotted sphere to an angle.
There are some more codes by which a sphere can be drawn. Let us plot a sphere of radius 2 by using polar coordinates.
r=2; % radius 2
o=0:0.1:2*pi; % theta
for i=0:31.4
h=i/10; % phi
x=r*sin(o)*cos(h);
y=r*sin(o)*sin(h);
z=r*cos(o);
plot3(x,y,z);
hold on
end
One of the function available in MATLAB is meshgrid( ). Let us see how we can plot a 3-D plot with its help.
like for e.g.
a= [1 2 3];
b=[6 7 8];
and we want to have elements (1,6) , (1,7), (1,8), (2,6), (2,7), (2,8), (3,6),(3,7), (3,8)
then [X,Y]=meshgrid(a,b) solves our problem
as it creates X= 1 2 3 Y= 6 6 6
1 2 3 7 7 7
1 2 3 8 8 8
Now see the following code to generate the sphere via meshgrid( )
a=-1:0.05:1; % an array
b=-1:0.05:1; % another array
[x,y]=meshgrid(a,b); % generates all the possible coordinate
%range from (-1,-1) to (1,1)
z=(1-(x.^2+y.^2)).^0.5; % equation of sphere with radius 1 and
%origin as centre
for i=1:41
for j=1:41
if imag(z(i,j))==0 % check to plot only real values that
%satisfy the eqn of sphere as they are
%the true values
plot3(x(i,j),y(i,j),z(i,j)) % plotting individual points
hold on
end
end
end
hold on
z=-((1-(x.^2+y.^2)).^0.5);
for i=1:41
for j=1:41
if imag(z(i,j))==0
plot3(x(i,j),y(i,j),z(i,j))
hold on
end
end
end
Using the meshgrid function and polar coordinates we have the following code for a sphere.
r=2; % radius =2
phi=linspace(0,pi,50); % phi=0 to pi divided in 50 slots
theta=linspace(0,2*pi,50);
[phi,theta]=meshgrid(phi,theta);
x=r*sin(phi).*cos(theta);
y=r*sin(phi).*sin(theta);
z=r*cos(phi);
plot3(x,y,z)
Now let us plot some other figures.Following is the code to plot a cone
o=pi/4; % apex angle/2
l=5;
for h=0:0.01:l*cos(o); % height from min to max
r=(l*cos(o)-h)*tan(o); % radius of the circle to pe plot in x,y plane
x=-r:0.01:r; % range of x
z=(x./x)*h; % z converted to a vector of same size as x
y=(r^2-x.^2).^0.5;
plot3(x,y,z);
hold on
w=-(r^2-x.^2).^0.5;
plot3(x,w,z);
hold on
end
Now let us plot a cube with 4 sides of side length 2 :-
x=0:0.01:2;
y=(x./x)*0;
w=(x./x)*2;
for a=0:0.01:2
z=(x./x)*a;
plot3(x,y,z) % xz plane plotted at y=0
hold on
plot3(x,w,z) % xz plane plotted at y=2
hold on
plot3(w,x,z) % yz plane plotted at x=2
hold on
plot3(y,x,z) % yz plane plotted at x=0
hold on
end
Now let us plot a line with direction cosines(2,1,1) and passing through (1,2,3)
k=-5:0.01:5;
x=2*k+1;
y=k+2;
z=k+3;
plot3(x,y,z)

Now let us plot a plane with equation 2x + 3y + 5z =10
a=0:0.1:5;
b=0:0.1:5;
[x,y]=meshgrid(a,b);
z=(10-(2*x+3*y))./5;
plot3(x,y,z,'b')

Now let us plot a cylinder of radius 2 and height 4.
k=-5:0.01:5;
x=2*k+1;
y=k+2;
z=k+3;
plot3(x,y,z)
Now let us plot a plane with equation 2x + 3y + 5z =10
a=0:0.1:5;
b=0:0.1:5;
[x,y]=meshgrid(a,b);
z=(10-(2*x+3*y))./5;
plot3(x,y,z,'b')
Now let us plot a cylinder of radius 2 and height 4.
r=2;
h=0:0.1:4;
theta=0:0.1:2*pi;
[H,THETA]=meshgrid(h,theta);
R=H./H.*r;
x=R.*cos(THETA);
y=R.*sin(THETA);
z=H;
plot3(x,y,z,'b');
3-D BAR GRAPHS AND PIE CHARTS
We learned to plot 2-D bar graphs and pie charts in my previous post. Now taking the profits of two companies in the corresponding years we will study 3-D bar graphs and the function used to plot the same is bar3( ).
year1= [2005 2006 2007 2008 2009 2010];
profit1=[500.43 600.76
562.62 970.45
357.81 1100.3
597.39 708.7
624.61 300.34 %first column company A
731.98 900.32 ]; %second column company B
bar3(year1,profit1,0.6);% default detached
title('detached');

Keeping all the rest statements same and changing the last two, in the above program, let us see some variations.The first is grouped and the other is stacked.
bar3(year1,profit1,'grouped');
title('grouped');


Let us now have a look at 3-D pie charts and the function used for it is pie3. Suppose we have 52 engineering, 24 medical ,16 art, 20 pharma and 80 maths students.
a=[52 24 16 20 80];
pie3(a);

Let us see a variation in the above code.
a=[52 24 16 20 80];
b=[1 0 0 1 0];
pie3(a,b);

year1= [2005 2006 2007 2008 2009 2010];
profit1=[500.43 600.76
562.62 970.45
357.81 1100.3
597.39 708.7
624.61 300.34 %first column company A
731.98 900.32 ]; %second column company B
bar3(year1,profit1,0.6);% default detached
title('detached');
Keeping all the rest statements same and changing the last two, in the above program, let us see some variations.The first is grouped and the other is stacked.
bar3(year1,profit1,'grouped');
title('grouped');
bar3(year1,profit1,'stacked');
title('stacked');
a=[52 24 16 20 80];
pie3(a);
Let us see a variation in the above code.
a=[52 24 16 20 80];
b=[1 0 0 1 0];
pie3(a,b);
This ends the basics of graph plotting in MATLAB.
04 March, 2012
SEMI/FULLY AUTOMATIC WATER PUMP DRIVER SYSTEM USING LOGIC GATES
Everyone uses submersible or normal water pumps to fill overhead tanks of their buildings or bungalows. These pumps are still operated manually by majority of people. Sometimes, the water pump may run dry in case of low water level. This may cause an internal damage to the pump. Sometimes, user may forget to switch it off resulting in overflow of overhead tank and wastage of water.

Now we will see how the sensors work. Water is conducting as salts are present in normal water. In tanks, Common anode is kept at the base which provides 5V, if any sensor gets immersed in water, due to conduction in water it becomes high. If water level is below a sensor it will be open circuited and we have to take good care of it as it is not grounded and some ICs take open circuit as high which is a practical problem because we want to take this condition as low. This problem can be solved by first inverting all the inputs using transistors (as inverters) and then again inverting them implementing the logic using IC’s.
In a few conditions, output ‘P’ takes its previous state as we can see in the above truth table.
This can be explained by taking the following example:


In my previous post FLOWING WATER INDICATOR, I mentioned about overcoming this problem but still it was manual and I also mentioned about the best solution i.e. using SEMI/FULLY AUTOMATIC PUMP DRIVER SYSTEM.
This system reduces human effort and completely avoids wastage of water and provides safe running of water pump.
- A fully automatic pump driver system intelligently switches on the water pump if the overhead tank gets empty below a certain level and if there is adequate water in the underground tank and it needs no human intervention. It will also switch it off or keep it switched off, if the overhead tank is full or in case of low water level in the underground tank.
- In the semi-automatic mode user will have to switch on the pump manually and the pump would get off automatically. This mode is useful in summers in scarce water conditions.
Usually, these types of systems are made using micro-controllers which increases the cost of circuit and makes it complex. Making it using logic gates, makes it cheaper.
It also makes it easier to be implemented by anyone who has a little knowledge of Boolean algebra and electronics.
AUTOMATIC PUMP DRIVER SYSTEM
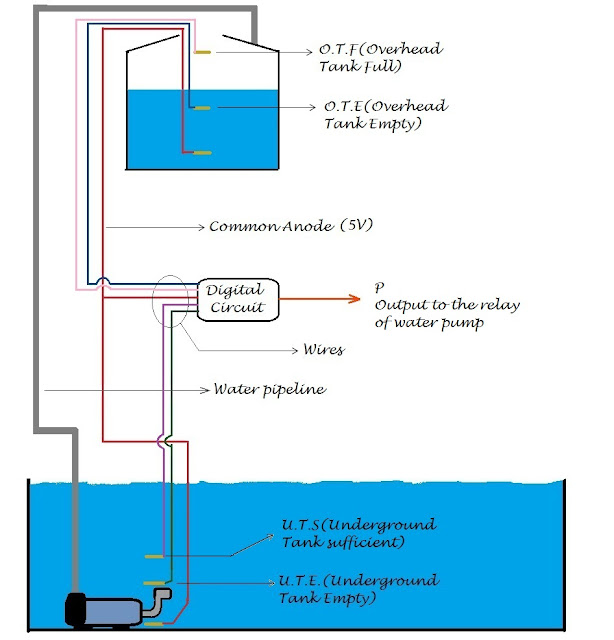
First, consider the image of a common water system :

In order to create an automatic pump driver system, signals from underground tank and overhead tank are required to find their status.
We put sensors for the same. In automatic system we require 6 sensors: 3 for overhead tank and 3 for underground tank.
Brass screws can be used as sensors as they do not rust but with time a scale gets deposited on their surface and they become non conducting and have to be replaced. Definitely it is a drawback but this is not a major worry as the process is very slow.
Let us consider the requirements of our system:
1) OVERHEAD TANK
The system should receive a signal when the overhead tank is full and also when the water level is below a particular level (which is considerd empty)
So we require two sensors ‘Overhead Tank Full’ and ‘Overhead Tank Empty’ for the same. Third one will be common anode for providing +5V. System won’t receive any signal from it.
2) UNDERGROUND TANK
The system should receive a signal when underground tank is empty and when water level has reached a particular level. So we have two sensors for the same: ‘Underground Tank Sufficient’ which says there is sufficient water in tank and ‘Underground Tank Empty’ which indicates no water in underground tank. Third one is again common anode which provides +5V.
 |
| brass screw sensors |
 |
| Another metal contact sensor covered by plastic case |
The sensors fixed at various levels are shown in the image below:

 |
| sensors in an overhead tank |
- Water level in no case will go above O.T.F. and when it goes below O.T.E. the tank is considerd empty.
- Water level can go above U.T.S.. Pump will switch on automatically only when water level in underground tank is above U.T.S. and in overhead tank below O.T.E. and can remain on till it reaches U.T.E. or overhead tank becomes full, whichever comes first.
- Pump will remain off if overhead tank is full or underground tank is empty.
- In rest all combinations of possible conditions, pump will remain in its previous state i.e. if it was off it will remain off and if on then it will remain on.
We will now see the system as a digital circuit and for that we need to analyse it in the terms of ones and zeroes. So let us consider a few conditions to make this more clear
- Underground Tank empty :- U.T.E. is 0 U.T.S is 0
- Sufficient water in U.T. :- U.T.E. is 1 U.T.S is 1
- Water level between U.T.S. and U.T.E. :- U.T.E is 1 U.T.S. is 0
- Overhead Tank empty :- O.T.E. is 0 O.T.F is 0
- Overhead Tank full :- O.T.E. is 1 O.T.F is 1
- Water level between O.T.S.and O.T.E. :- O.T.E is 1 O.T.S. is 0
We have 4 inputs: U.T.E., U.T.S., O.T.E. and O.T.F. Let us consider the truth table so that we determine all possible conditions:
P is the output to the pump's relay.
U.T.E. | U.T.S. | O.T.E. | O.T.F | Condition | P |
0 | 0 | 0 | 0 | U.T. & O.T. empty | 0 |
0 | 0 | 0 | 1 | Not Possible | X |
0 | 0 | 1 | 0 | U.T. empty, O.T. neither full nor empty | 0 |
0 | 0 | 1 | 1 | U.T. empty, O.T. full | 0 |
0 | 1 | 0 | 0 | Not Possible | X |
0 | 1 | 0 | 1 | Not Possible | X |
0 | 1 | 1 | 0 | Not Possible | X |
0 | 1 | 1 | 1 | Not Possible | X |
1 | 0 | 0 | 0 | U.T. neither full nor empty, O.T. empty | Previous state |
1 | 0 | 0 | 1 | Not Possible | X |
1 | 0 | 1 | 0 | U.T. neither full nor empty, O.T. neither full nor empty | Previous state |
1 | 0 | 1 | 1 | U.T. neither full nor empty, O.T. full | 0 |
1 | 1 | 0 | 0 | U.T. full, O.T. empty | 1 |
1 | 1 | 0 | 1 | Not Possible | X |
1 | 1 | 1 | 0 | U.T. full, O.T. neither full nor empty | Previous state |
1 | 1 | 1 | 1 | U.T. full, O.T. full | 0 |
In a few conditions, output ‘P’ takes its previous state as we can see in the above truth table.
This can be explained by taking the following example:
U.T.E. | U.T.S. | O.T.E. | O.T.F. |
1 | 1 | 1 | 0 |
There is sufficient water in the underground tank and in overhead tank water level is between O.T.E. and O.T.F. i.e. overhead tank is neither full nor empty. This situation can arise in two cases:
1) Let us assume that overhead tank is full so the pump is off and P=0. Now with consumption of water, it will drop below O.T.F. and the above illustrated condition will occur.We cannot keep the pump on because if we do so, process of pump on and off will occur too fast (approximately after every minute or so). As the water level will lose contact with O.T.F. sensor, pump will switch on and now the tank will get full too soon and the pump will switch off. This fast occurring cycle can damage the water pump. Hence, O.T.E. has its own significance that the pump should switch on only when it is low.
1) Let us assume that overhead tank is full so the pump is off and P=0. Now with consumption of water, it will drop below O.T.F. and the above illustrated condition will occur.We cannot keep the pump on because if we do so, process of pump on and off will occur too fast (approximately after every minute or so). As the water level will lose contact with O.T.F. sensor, pump will switch on and now the tank will get full too soon and the pump will switch off. This fast occurring cycle can damage the water pump. Hence, O.T.E. has its own significance that the pump should switch on only when it is low.
2) Now assume the overhead tank to be empty i.e. O.T.E. low. Pump will switch on and the tank will start filling. Now the same condition will again occur and we cannot keep the pump off as we are required to fill the tank till brim, once the pump is on.
So, in certain conditions the ‘P’ has to take its own previous value that if it was off it should be off and if it was on it should be the same.
For ‘P’ to have its own previous value in some states, we will have to give feedback i.e. our circuit will have one more input P(n) and output from it will be P(n+1).And so we have the final truth table:
P(n) | U.T.E. | U.T.S. | O.T.E. | O.T.F. | P(n+1) |
0 | 0 | 0 | 0 | 0 | 0 |
0 | 0 | 0 | 0 | 1 | X |
0 | 0 | 0 | 1 | 0 | 0 |
0 | 0 | 0 | 1 | 1 | 0 |
0 | 0 | 1 | 0 | 0 | X |
0 | 0 | 1 | 0 | 1 | X |
0 | 0 | 1 | 1 | 0 | X |
0 | 0 | 1 | 1 | 1 | X |
0 | 1 | 0 | 0 | 0 | 0=P(n) |
0 | 1 | 0 | 0 | 1 | X |
0 | 1 | 0 | 1 | 0 | 0= P(n) |
0 | 1 | 0 | 1 | 1 | 0 |
0 | 1 | 1 | 0 | 0 | 1 |
0 | 1 | 1 | 0 | 1 | X |
0 | 1 | 1 | 1 | 0 | 0=P(n) |
0 | 1 | 1 | 1 | 1 | 0 |
1 | 0 | 0 | 0 | 0 | 0 |
1 | 0 | 0 | 0 | 1 | X |
1 | 0 | 0 | 1 | 0 | 0 |
1 | 0 | 0 | 1 | 1 | 0 |
1 | 0 | 1 | 0 | 0 | X |
1 | 0 | 1 | 0 | 1 | X |
1 | 0 | 1 | 1 | 0 | X |
1 | 0 | 1 | 1 | 1 | X |
1 | 1 | 0 | 0 | 0 | 1=P(n) |
1 | 1 | 0 | 0 | 1 | X |
1 | 1 | 0 | 1 | 0 | 1=P(n) |
1 | 1 | 0 | 1 | 1 | 0 |
1 | 1 | 1 | 0 | 0 | 1 |
1 | 1 | 1 | 0 | 1 | X |
1 | 1 | 1 | 1 | 0 | 1=P(n) |
1 | 1 | 1 | 1 | 1 | 0 |
Now we can deduce an expression from the table by having the minterms that produce 1.
Let P(n)=A, U.T.E.=B, U.T.S.=C, O.T.E.=D, O.T.F.=E, P(n+1)=Z for simplicity in calculations.
Z=A’BCD’E’+ABC’D’E’+ABC’DE’ +ABCD’E’+ABCDE’
=A’BCD’E’ + ABC’E’(D + D’) + ABCE’(D + D’)
=A’BCD’E’ + ABC’E’ + ABCE’
=A’BCD’E’ + ABE’(C + C’)
=A’BCD’E’ + ABE’
=BE’(A’CD’ + A)
=BE’(A + CD’)(A + A’)
=ABE’+ BCD’E’
So we have the final expression
P(n+1)= P(n).UTE.OTF’ + UTE.UTS.OTE’.OTF’
We can have a simple circuit to implement the above expression:
 |
| Circuit with pump in on state |
 |
| Circuit with pump in off state |
Connecting LEDs is helpful so that the user can determine the status of overhead tank and underground tank. This system is very convenient and requires no human intervention.
SEMI-AUTOMATIC PUMP DRIVER SYSTEM
In summers, in scarce water conditions, suppose the water level is maintained between U.T.S. and U.T.E. and overhead tank is completely empty. It will not work till the water level is above U.T.S. In this case automatic system fails and user will switch the pump on manually i.e. by switching to manual mode. Now, in no case pump should be on when water level is below U.T.E. (pump would be running dry) and when O.T.F. is high (overhead tank full). In manual mode nothing would be taken care of so Semi-automatic Pump Driver System comes into picture.
User will only have to switch on the pump and it will intelligently switch it off. As mentioned earlier two conditions are taken care of:
- U.T.E. should not be low.
- O.T.F should not be high
So the system requires only 3 inputs: U.T.E., O.T.F and user’s input U.
We omit the sensors O.T.E. and U.T.S because they are not required and hence we consider the following diagram:

As we have 3 inputs, out of which one will be from the user. User will just press a push to on button for switching on the pump so just a trigger will be given and for converting it to a sustained input we will again require feedback. It will become more clear from the truth table.
U(n) | U.T.E. | O.T.F. | U(n+1) | P |
0 | 0 | 0 | 0 | 0 |
0 | 0 | 1 | 0 | 0 |
0 | 1 | 0 | 0 | 0 |
0 | 1 | 1 | 0 | 0 |
1 | 0 | 0 | 0 | 0 |
1 | 0 | 1 | 0 | 0 |
1 | 1 | 0 | 1 | 1 |
1 | 1 | 1 | 0 | 0 |
We get a 1 for P and U(n+1) only when U.T.E. is high, OTF is low and user wishes to switch on the pump i.e U(n) is high.
So we can have the expression from the truth table.
P= UTE.U(n).OTF’
For the above expression we can have the following circuit:
 |
| Circuit with pump on |
 |
| Circuit with pump off |
As only two inputs (U.T.E. and O.T.F.) amongst the four in automatic pump driver are used here, we can make a system which has both modes automatic as well as semi-automatic. Infact we can add a manual mode too in the system. This will be a complete system and will give no problems.
SEMI/FULLY AUTOMATIC WATER LEVEL INDICATOR AND CONTROLLER
We can make this by combining all the three modes: automatic, semi-automatic and manual. This can be done by giving a 3-way switch on relay’s input i.e. relay will take input from the mode, which user has selected.

The above circuit seems to be complex but is not actually. The relay has been connected to a 3-way switch i.e. it can get three inputs from three systems. The system requires the same number of sensors as in automatic pump driver system. The circuit in red outline is of automatic mode, in green outline is of semi-automatic mode and in black is of manual mode.
The latter two we have studied. In manual mode switching the pump on and off is user’s wish so no input is taken in the circuit. Two inverter gates are put to for delay so that feedback works. If user pushes to on once, the ouput is fed back to the input and pump remains on. If user pushes to switch off, output is grounded and logic ‘0’ is fed to switching on input and the pump stops.
So, we have the circuit:

Considering all the above three systems, some users may only want to prevent overhead tank overflow and for that we can make a much simpler system.
OVERHEAD TANK OVERFLOW GUARD
This system will prevent tank overflow and the system will have only two inputs for monitoring basis: O.T.F. and U(n). This is the simplest system among all and covers the most important function. Circuit of the system will be:

Installing an appropriate system from all the above systems will reduce human efforts and will help to manage and conserve water well.
Subscribe to:
Comments (Atom)